
There are 7 parts in QTP. They are listed as follows:
1.Test Pane
2.Active Screen
3.DataTable
4.Debug viewer pane
5.Information Pane
6.Missing Resources Pane
7.Tools Options
TestPane shows the script in two views.
1.Expert view
2.Keyword view
i) Item
ii) Operation
iiI)Value
iv) Documentation
i) Item Column:
The item on which you want to perform the step (test object, utility object, function call, or statement). This column displays a hierarchical icon-based tree. The highest level of the tree are actions, and all steps are contained within the relevant branch of the tree. Steps performed within the same parent object are displayed under that same object. Function calls, utility objects, and statements are placed in the tree hierarchy at the same level as the item above them (as a sibling).
ii)Operation Column:
The operation to be performed on the item. This column contains a list of all available operations (methods, functions, or properties) that can be performed on the item selected in the Item column, for example, Click and Select. The default operation for the item selected in the Item column is displayed by default.
iii)Value Column:
The argument values for the selected operation, or the content of the statement. The Value cell is partitioned according to the number of arguments of the selected operation.
If an argument has a predefined list of values, QTP provides a drop-down list of possible values. If a list of values is provided, you cannot manually type a value in this box.
iv)Documentation:
The Documentation column translates each of the steps into understandable sentences.


II) Active Screen:
'Active screen' is an area provided by QTP which holds the snapshots related to each and every recorded statements and used for easily understanding & enhansing the script.
Note: You can display the Active Screen by choosing View > Active Screen, or by clicking the Active Screen button .
.
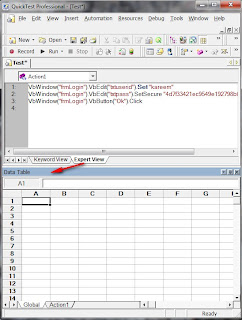
 III) DataTable:
'DataTable' is an Important feature provided by the QTP .It is like an Excel sheet which provides the following facilities:
1)It is used for handling the test data.
2)It isolates the test script from the 'data source'.
3)It provides the provision to import the data from different data sources very easily.
4)It provides the provision to interact with the data directly.
Note: You can display the Data Table pane by choosing View > Data Table, or by clicking the Data Table button .
.
 IV)Debug Viewer Pane:
It is an area provided by QTP which is used for viewing,modifying (or) setting the current values of the variables during the execution break with the help of 'three tabs'. They are listed below:
1) watch
2) variables
3) commands
Note: The Debug Viewer pane is not displayed when you open QTP for the first time. You can display the Debug Viewer by choosing View > Debug Viewer.
 V)Information Pane:
It displays a list of syntax errors found in your test and function library scripts.
Note: You can display the Information pane by choosing View > Information.

VI) Missing Resources Pane:
Provides a list of the resources that are specified in your test but cannot be found, such as missing Recovery Scenarios and missing Function Libraries.
Note: The Missing Resources pane is not displayed when you open QTP for the first time. You can display the Missing Resources pane by choosing View > Missing Resources, or by clicking the Missing Resources button .
.
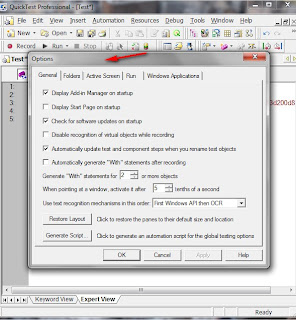
 VII)Tools Options:
It provides various services to us to configure our QTP tool to compatible with the application what we have to test.
1.Test Pane
2.Active Screen
3.DataTable
4.Debug viewer pane
5.Information Pane
6.Missing Resources Pane
7.Tools Options
I) TestPane:
TestPane is an area provided by QTP.which is used to developing,viewing & modifying the test script.TestPane shows the script in two views.
1.Expert view
2.Keyword view
1.Expert View:
It shows the script in vbscript format. 2.Keyword view:
It shows the script in a graphical user interface which is further divided into 4 parts.i) Item
ii) Operation
iiI)Value
iv) Documentation
i) Item Column:
The item on which you want to perform the step (test object, utility object, function call, or statement). This column displays a hierarchical icon-based tree. The highest level of the tree are actions, and all steps are contained within the relevant branch of the tree. Steps performed within the same parent object are displayed under that same object. Function calls, utility objects, and statements are placed in the tree hierarchy at the same level as the item above them (as a sibling).
ii)Operation Column:
The operation to be performed on the item. This column contains a list of all available operations (methods, functions, or properties) that can be performed on the item selected in the Item column, for example, Click and Select. The default operation for the item selected in the Item column is displayed by default.
iii)Value Column:
The argument values for the selected operation, or the content of the statement. The Value cell is partitioned according to the number of arguments of the selected operation.
If an argument has a predefined list of values, QTP provides a drop-down list of possible values. If a list of values is provided, you cannot manually type a value in this box.
iv)Documentation:
The Documentation column translates each of the steps into understandable sentences.


II) Active Screen:
'Active screen' is an area provided by QTP which holds the snapshots related to each and every recorded statements and used for easily understanding & enhansing the script.
Note: You can display the Active Screen by choosing View > Active Screen, or by clicking the Active Screen button
.
'DataTable' is an Important feature provided by the QTP .It is like an Excel sheet which provides the following facilities:
1)It is used for handling the test data.
2)It isolates the test script from the 'data source'.
3)It provides the provision to import the data from different data sources very easily.
4)It provides the provision to interact with the data directly.
Note: You can display the Data Table pane by choosing View > Data Table, or by clicking the Data Table button
.It is an area provided by QTP which is used for viewing,modifying (or) setting the current values of the variables during the execution break with the help of 'three tabs'. They are listed below:
1) watch
2) variables
3) commands
Note: The Debug Viewer pane is not displayed when you open QTP for the first time. You can display the Debug Viewer by choosing View > Debug Viewer.

It displays a list of syntax errors found in your test and function library scripts.
Note: You can display the Information pane by choosing View > Information.

VI) Missing Resources Pane:
Provides a list of the resources that are specified in your test but cannot be found, such as missing Recovery Scenarios and missing Function Libraries.
Note: The Missing Resources pane is not displayed when you open QTP for the first time. You can display the Missing Resources pane by choosing View > Missing Resources, or by clicking the Missing Resources button
. 
It provides various services to us to configure our QTP tool to compatible with the application what we have to test.

No comments:
Post a Comment